Analyzed 28,491 contest entries using Microsoft SQL Server to identify profit drivers. 10 complex analytical queries demonstrating CTEs, window functions, and aggregate analysis. 80% of $113,813 profit came from 7.68% first-place finishes.
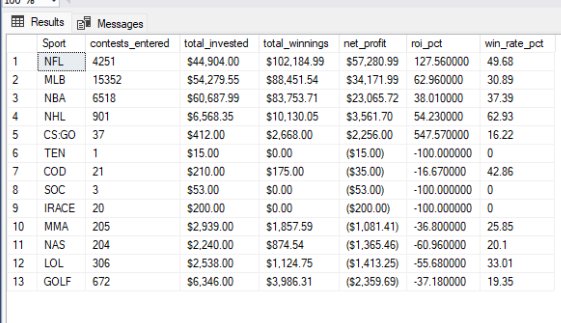
Power BI Performance Analytics:
Daily Fantasy Sports (2015–2021)
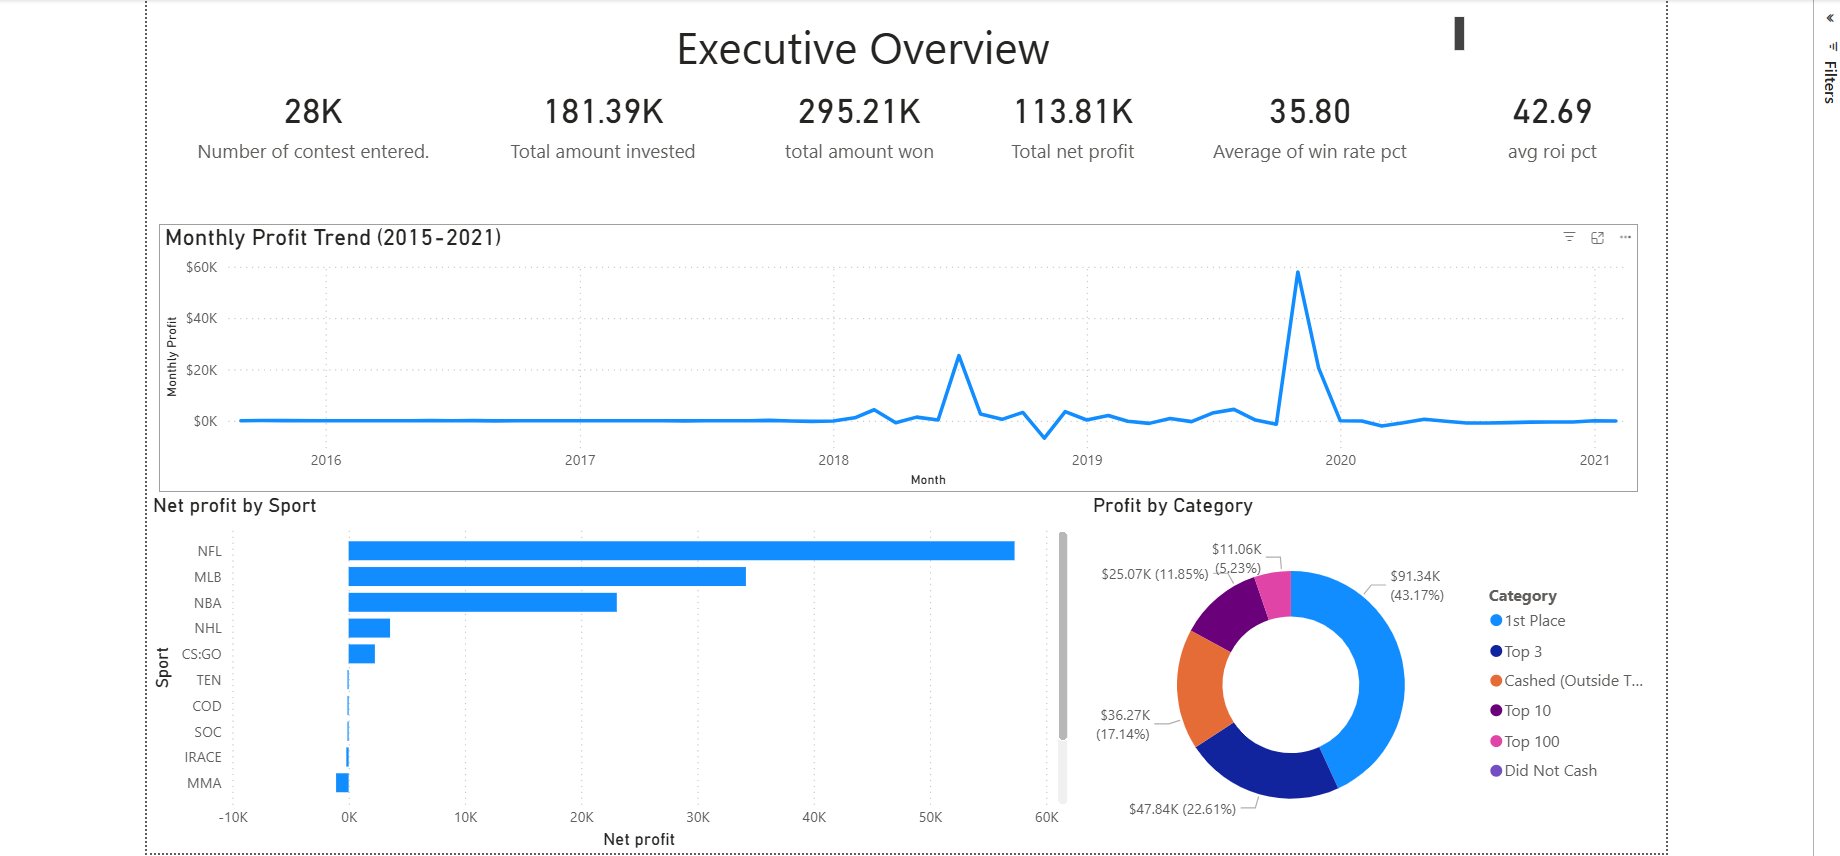
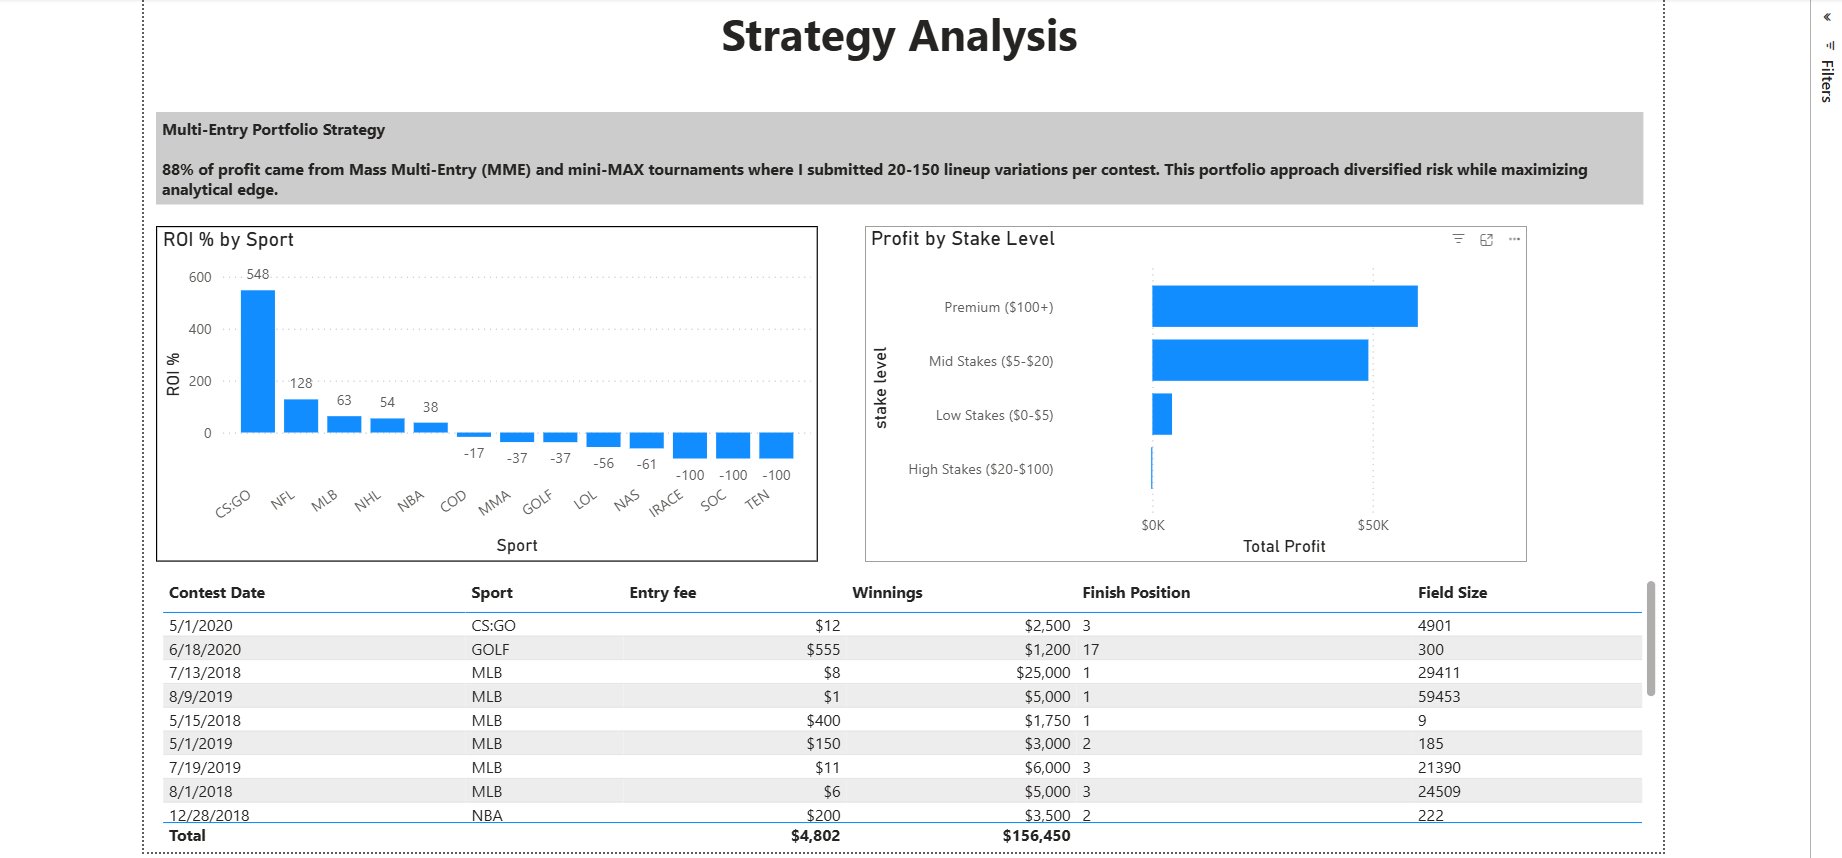
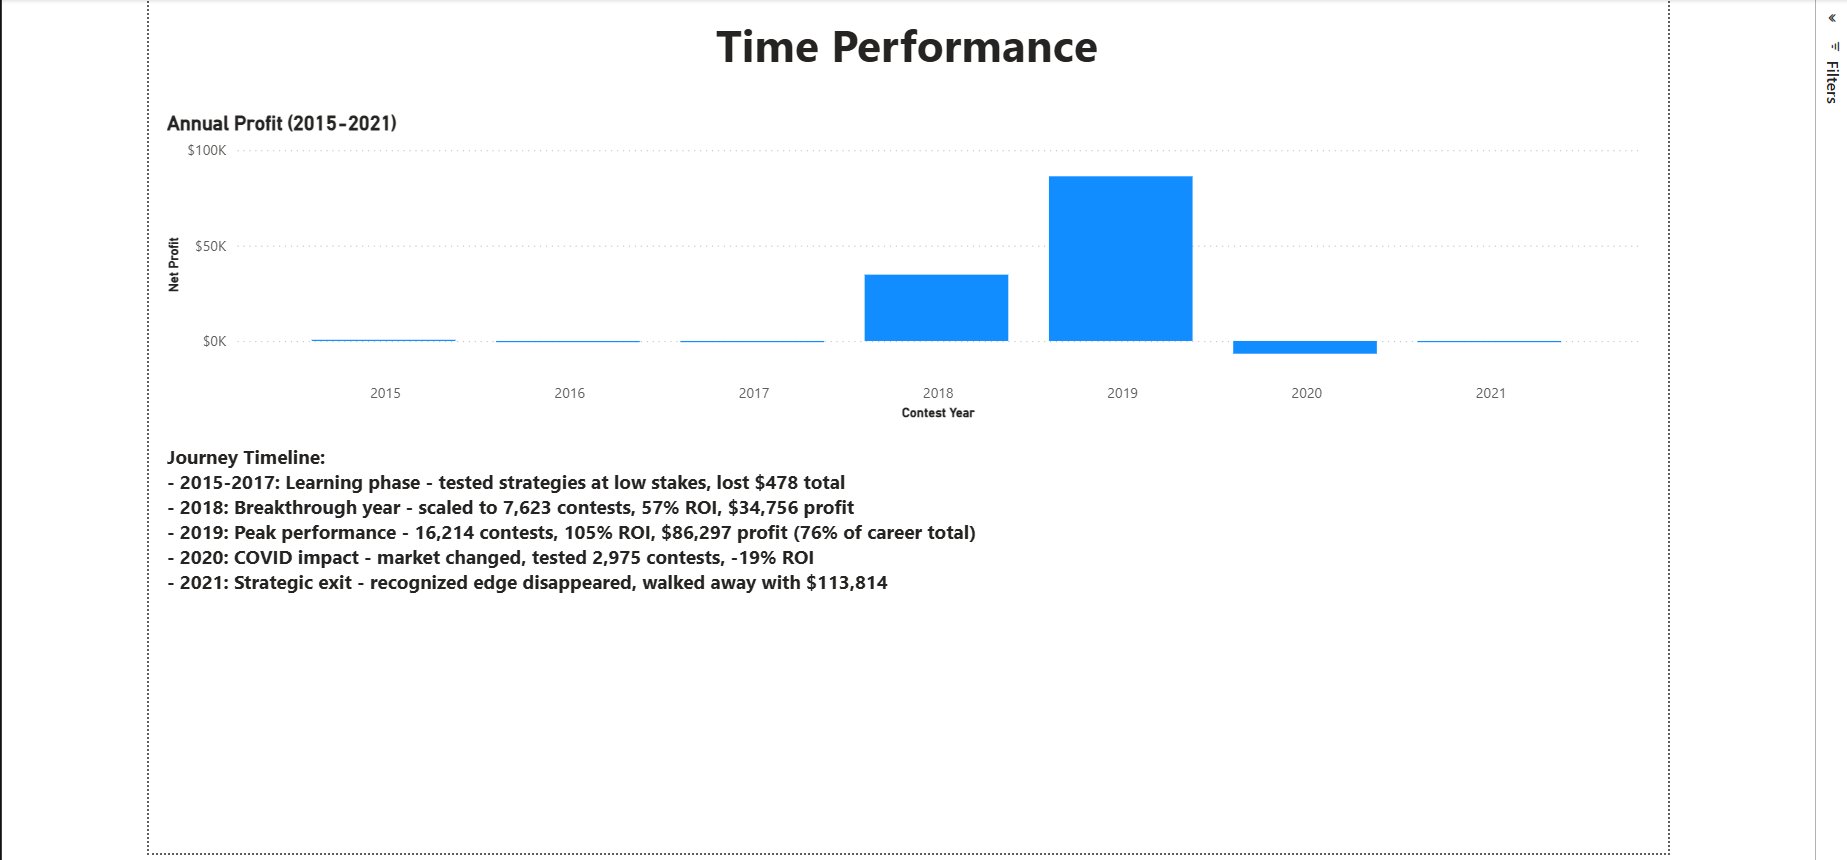
Built a 3-page Power BI report analyzing 28,000+ contest entries across 10 sports. Visualized $113,814 net profit through KPI dashboards, sport-level ROI analysis, stake-level profitability segmentation, and a 7-year time performance narrative. Multi-entry portfolio strategy delivered a 42.69% average ROI.